Trend analysis is a method in Technical Analysis that helps in predicting the future movement of that is based on the current ongoing trend data.
Trend analysis gives an idea to the traders based on what has happened in the past and what will be happening in the future.
There are mainly three types of trends: short, long-term, and intermediate trends.
In this blog we will discuss how trend analysis works and different trend analysis strategies:
How does Trend Analysis work?
Trend analysis helps in predict a trend, whether the market is in a bull or bearish run and it also suggests whether a trend reversal is going to take place, like from a bull-to-bear market.
Trend analysis helps the traders to make a profit when they trade along with the trend and not against it.
It helps the traders to understand the ongoing price direction in the market during a particular period.
Trends can be up or down based on the bullish and bearish market sentiments respectively.
One should note that the longer the trend the more reliable it is.
Traders can also analyze whether a trend in one sector could result in the same trend in the sector.
Trend Analysis Strategies:
Below are few trend analysis strategies which traders can follow while trading in the market:
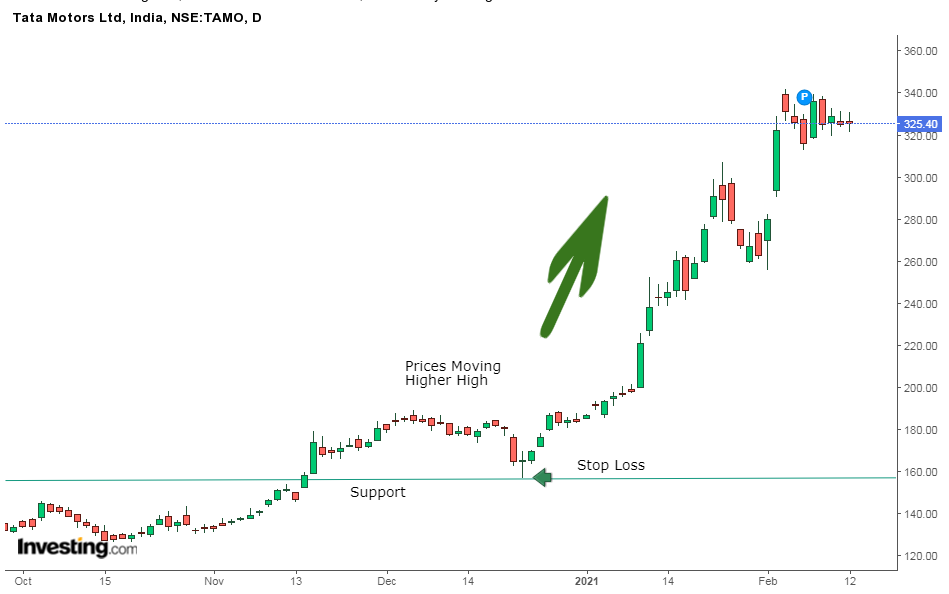
1. Trendlines and Chart Patterns:
Traders can enter long positions when a particular stock is trending higher and can place a stop-loss below the key trendline i.e support or resistance levels. In the case of a trend reversal, the position is squared.
Below is an example of the daily chart of Tata Motors Ltd., where we can see that the stock is trending higher and can place a stop-loss below or at the support.
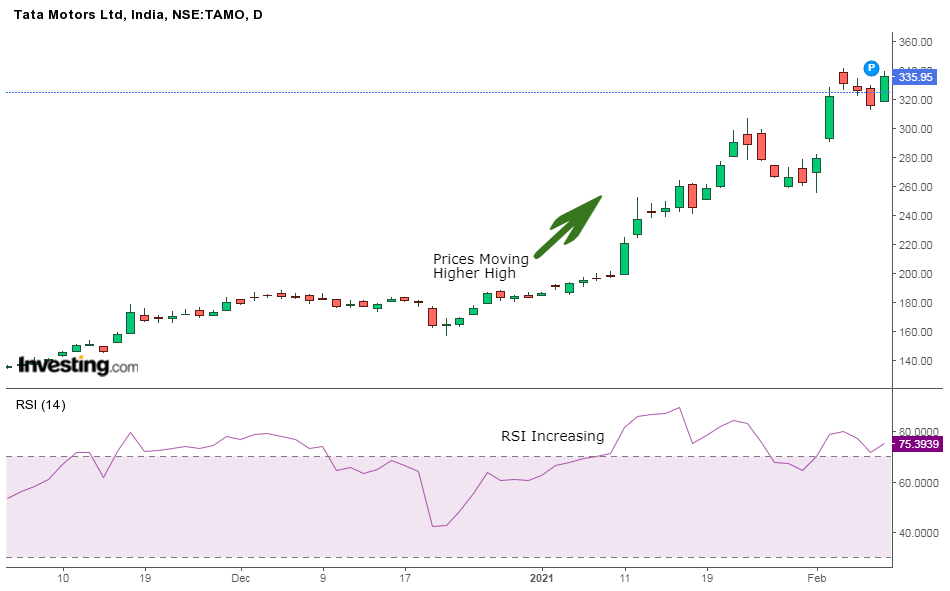
2. Momentum Indicators:
Traders can enter long positions when a particular stock is trending up or down with strong momentum and square off long positions when the stock loses momentum. Traders can use the relative strength index (RSI) is used in these strategies.
Below is an example of the daily chart of Tata Motors Ltd., where we can see that the stock is trending higher as momentum is increasing.

3. Moving Averages:
Traders can enter long positions when a short-term moving average crosses above a long-term moving average and vice versa.
Below is an example of the daily chart of Tata Motors Ltd., when we can see that the traders can enter long positions when a short-term moving average crosses above a long-term moving average:
Indicators help in simplifying price information, and also provide us with trend trade signals or reversal signals.
These indicators can be used on all time frames and can be adjusted according to the trader’s specific preferences.
Traders should combine indicator strategies or they can come up with their own strategies, so entry and exit criteria can be clearly established for trades.
Key Takeaways:
- Trend analysis is a method in Technical Analysis that helps in predicting the future movement of that is based on the current ongoing trend data.
- There are mainly three types of trends: short, long-term, and intermediate trends.
- Trend analysis helps the traders to make a profit when they trade along with the trend and not against it.
- Trend analysis helps in predict a trend, whether the market is in a bull or bearish run and it also suggests whether a trend reversal is going to take place, like from a bull-to-bear market.
- Traders should combine indicator strategies or they can come up with their own strategies, so entry and exit criteria can be clearly established for trades.

 Jeff rown’...


.jpg)


.png)


No comments:
Post a Comment