The symmetrical triangle pattern is a continuation chart pattern like Ascending and Descending Triangle patterns.
This pattern is characterized by two converging trend lines that connect a series of troughs and peaks.
The trend lines should be converging to make an equal slope.
This pattern indicates a phase of consolidation before the prices breakout.
Let us discuss the formation of symmetrical triangle pattern and how to trade with it:
What is a Symmetrical Triangle Chart Pattern?
The Symmetrical Triangle Chart Pattern indicates an ongoing period of price consolidation before the prices breakout.
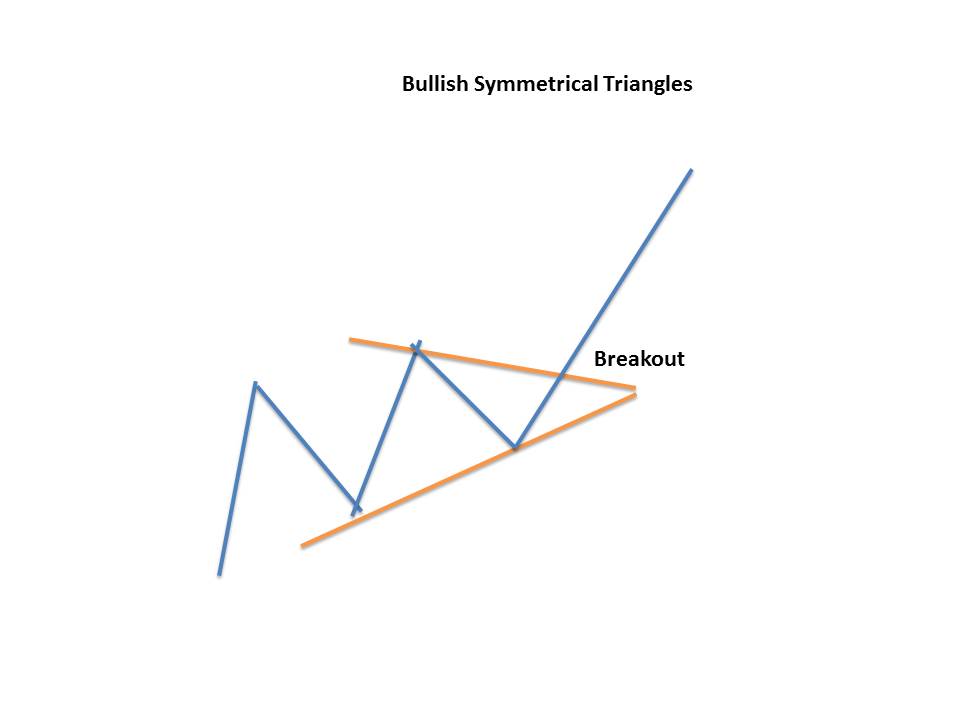
A bullish symmetrical triangle is a bullish continuation chart pattern, the movement preceding the triangle’s formation must be bullish.
On the other hand, A bearish symmetrical triangle is a bearish continuation chart pattern, the movement preceding the triangle’s formation must be bearish.
The symmetrical triangle pattern is different from a descending or ascending triangle pattern as both triangles’ lower and upper trend lines slope towards the center point.
A horizontal upper trendline is formed in ascending triangles that predict a higher breakout.
With a descending triangle, a horizontal lower trendline is formed that predicts a lower breakout.
The trend lines should be equal in their convergence slope when a symmetrical triangle is formed.
Formation of the Symmetrical Triangle Chart Pattern
Here is the formation of the Symmetrical Triangle Chart Pattern:
Trading with Symmetrical Triangle Chart Pattern
When trading with Symmetrical Triangle Chart Pattern, there are certain rules to be kept in mind:
- The converging trend lines should be converging to make an equal slope.
- The bullish symmetrical triangle should be formed in an ongoing uptrend and the prices should breakout from the upper trend line.
- The bearish symmetrical triangle should be formed in an ongoing downtrend and the prices should breakout from the lower trend line
Example
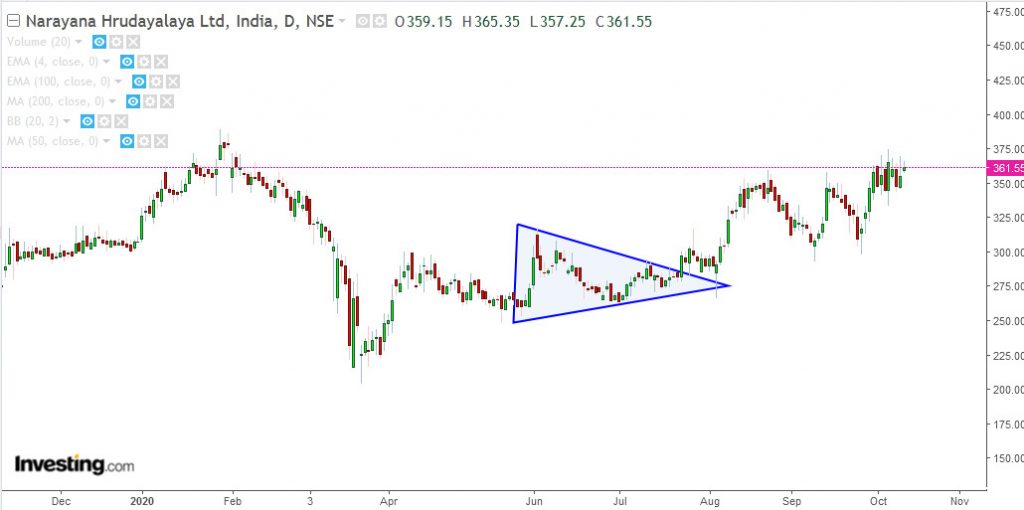
Below is the example of the bullish symmetrical triangle formed on the daily chart of Narayana Hrudayalaya Ltd.
We can see how it is formed in an ongoing uptrend and prices breakout from the upper trend line in the direction of the prior trend:
Stop Loss
The stop loss is placed right before the breakout point in a symmetrical triangle chart pattern.
Price Target
The price target is equal to the distance from the high and low of the earliest part of the pattern applied to the breakout price point.
The Symmetrical triangle works best with other chart pattern analysis.
Traders when using symmetrical triangles patterns, look for a high volume movement in a share price so the breakout is confirmed.
Other indicators can also help in estimating the duration of the breakout.
For example, the Relative Strength Index is used with the symmetrical triangle to estimate when the stock has become overbought after its breakout.
Key Takeaways
- The Symmetrical Triangle is a continuation chart pattern like Ascending and Descending Triangle patterns.
- The Symmetrical Triangle Pattern indicates an ongoing period of price consolidation before the prices breakout.
- The bullish symmetrical triangle pattern should be formed in an ongoing uptrend and the prices should breakout from the upper trend line.
- The bearish symmetrical triangle should be formed in an ongoing downtrend and the prices should breakout from the lower trend line
- When trading with Symmetrical Triangle Pattern, there are certain rules to be kept in mind


 Jeff rown’...


.jpg)


.png)


No comments:
Post a Comment